Polygenic score and imputation accuracy from low-pass sequencing in diverse populations
This documentation provides comprehensive information on the code, data, and methods used in the article.
Traditional GWAS and PGS studies utilize SNP arrays with genotype imputation; however, low-pass whole-genome sequencing (lpWGS) has emerged as a strong alternative.
Article Summary
General purpose: To compare the performance of genotyping arrays and low-pass WGS.
Study Design
- Compared: 8 genotyping arrays vs. 6 lpWGS coverage levels (0.5× to 2×)
- Population: 2,504 individuals from five superpopulations in the 1000 Genomes Project.
- Methods: Applied 10-fold cross-validation to perform genotype imputation and evaluate polygenic scores (PGS) across 4 traits. Results were summarized and assessed for performance.
Key Findings
- lpWGS matched population-optimized arrays in imputation and PGS accuracy
- lpWGS outperformed arrays in underrepresented populations
- lpWGS was superior for rare and low-frequency variants
Conclusion
Low-pass WGS is a flexible and powerful alternative to genotyping arrays, especially valuable for studies involving diverse or underrepresented populations.
Analytical Pipeline
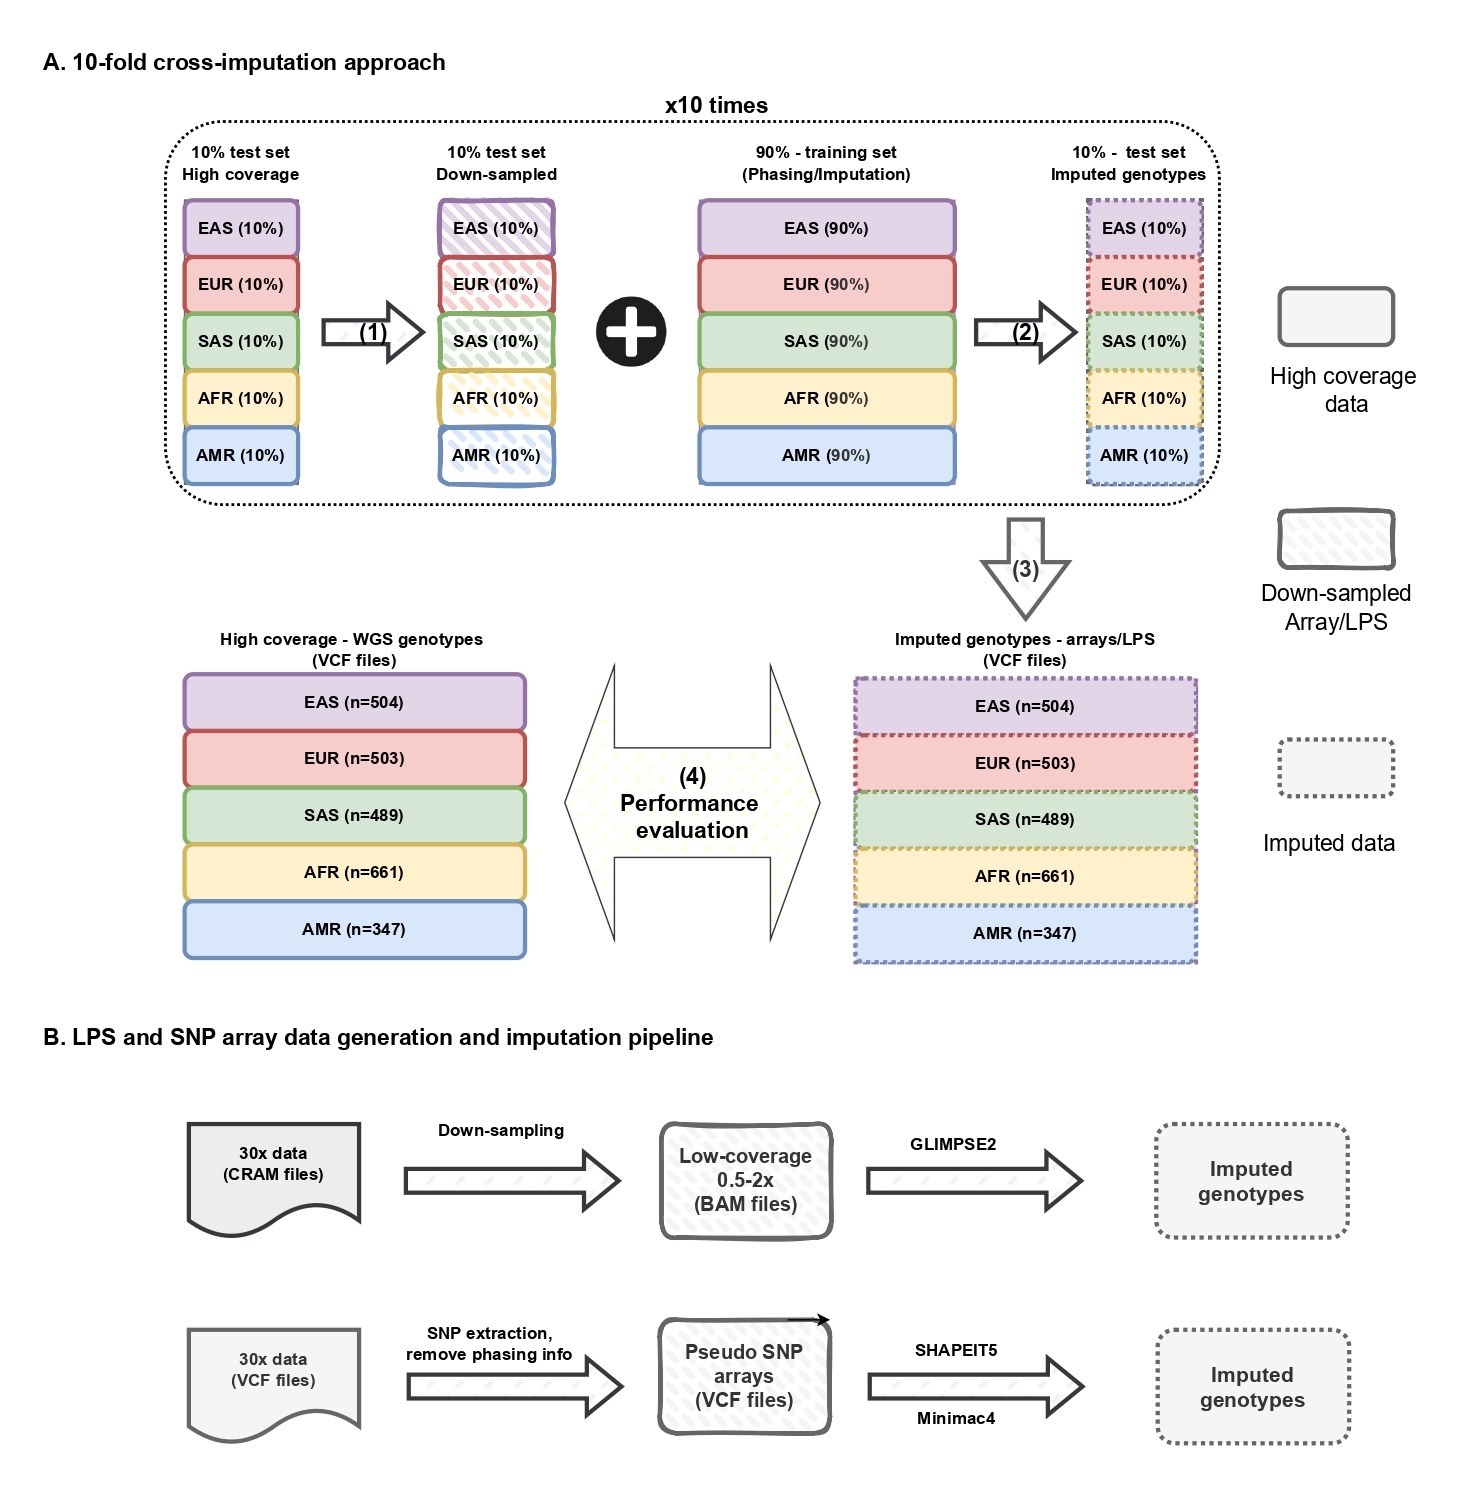
This study analyzes data from 2,504 unrelated individuals in the 1000 Genomes Project1, which was sequenced at high coverage (30x) by the New York Genome Center (1KGPHC). Two main datasets were utilized:
- Mapped sequence data (CRAM format)
- Phased variant data (VCF format)
Processes
- Processing data:
- Cross-Validation Framework: A 10-fold stratified cross-validation ensures balanced population representation for imputation testing.
- Variant Filtering: VCF files were filtered to improve imputation accuracy.
- Data Simulation: Low-pass sequencing and eight SNP arrays data were simulated from high-coverage data.
- Genotype Imputation:
- lpWGS: GLIMPSE2 was used for lpWGS imputation.
- SNP arrays: undergo phasing with SHAPEIT5 and imputation with Minimac4.
- Evaluation:
- Restructure imputed data: Imputed data was merged by population
- lpWGS performance: compared to 30x WGS to assess accuracy and coverage performance, followed by visualization.
- PRS performance: We calculated PRS and compared it to 30× WGS to assess PRS performance and visualize the results.
Appendix
- Available data: Information on the datasets used in this study.
- About: Acknowledging contributions and support.
-
Marta Byrska-Bishop, Uday S Evani, Xuefang Zhao, Anna O Basile, Haley J Abel, Allison A Regier, André Corvelo, Wayne E Clarke, Rajeeva Musunuri, Kshithija Nagulapalli, and others. High-coverage whole-genome sequencing of the expanded 1000 genomes project cohort including 602 trios. Cell, 185(18):3426–3440, 2022. ↩